How to track JavaScript errors with Google Tag Manager and Sentry
Google Analytics is NOT the right place to keep track of your JS errors. Read here how to use Sentry instead.

Justus
owntag Founder
published July 22, 2020
If you are serious about your tracking setup like the rest of us, you, too, copy and paste code from StackOverflow into GTM all the time. But does the code work flawlessly 100% of the time? You don’t know and that’s why you need to monitor errors caused by the code in your container.
There are literally hundreds of articles about how to track JavaScript errors occuring in Google Tag Manager with Google Analytics, usually with events and the error message as the event label. This is not one of those articles.
Google Analytics – or any other web analytics system you may use – is not the right place to track JS errors:
- They carry no meaningful information about what counts: your business. They also don’t tell you anything about the user or how they use and perceive your website, at least not as long as we’re talking about errors which happen quietly in the background.
- GA events don’t track much context that comes with those errors. Not having detailled technical information like a stack trace right there with the error makes it much harder to pinpoint the source of the problem.
- Events use up your monthly hit quotas, especially the 10-million-hits-per-month-per-property (for the free edition of GA) and the 500-hits-per–session limits. While both may sound pretty generous, some of your JavaScript errors could easily occur tens or hundreds of times within the same session. You don’t want to risk losing actually meaningful data because you reach the limits earlier than expected.
There’s gotta be a better way: Sentry
Instead of a web analytics system, use the right tool for the job: A dedicated frontend error tracking tool. There are several established ones on the market but I usually recommend Sentry.

They have a free tier which gives you a quota of 5k errors with 30 day data retention which is a good start.
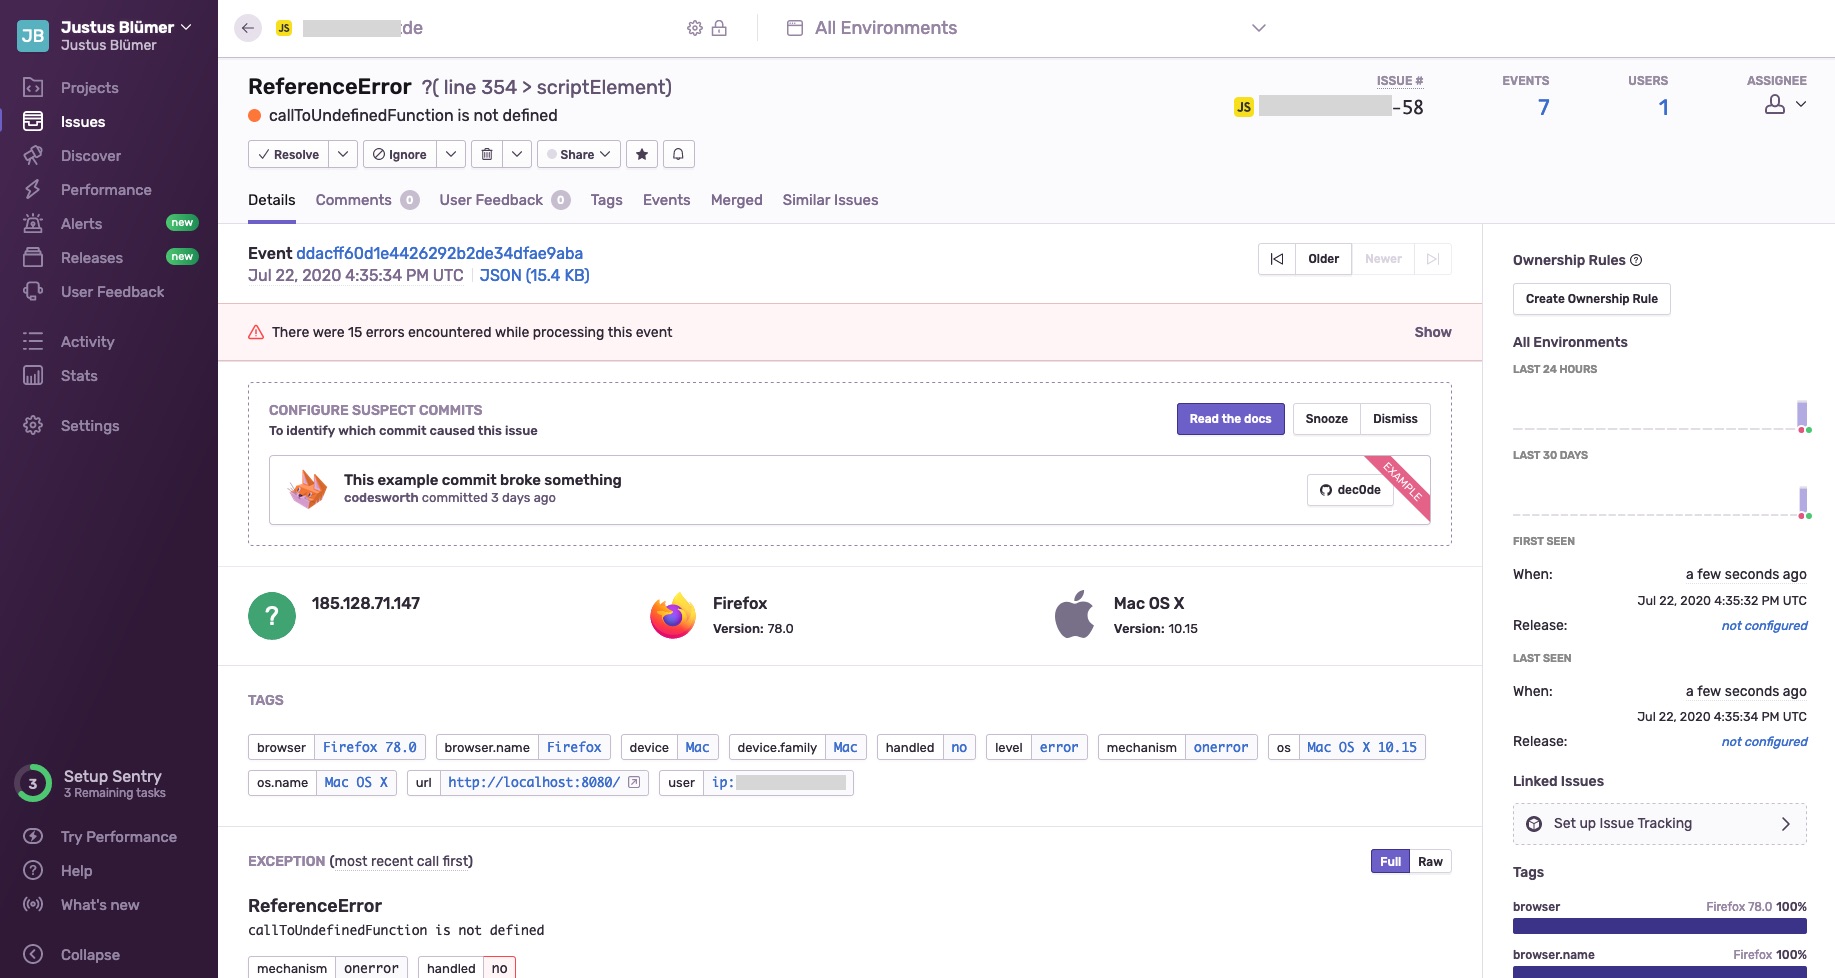
This is what it will look like if Sentry shows you an error that happened somewhere in your GTM container:

Getting all that information like browser distribution, error frequency, user meta data and such into a single unified view with GA or even with Google Data Studio would be a lot of work. It would not be as easy to use, either.
Implement the Sentry SDK
To be able to send information about JS errors occurring on your website, you need to add the Sentry JavaScript SDK. To get the necessary code snippets, go to check out Sentry’s documentation for the SDK installation. Make sure you’re logged in so your personalized codes are displayed there – quite convenient.
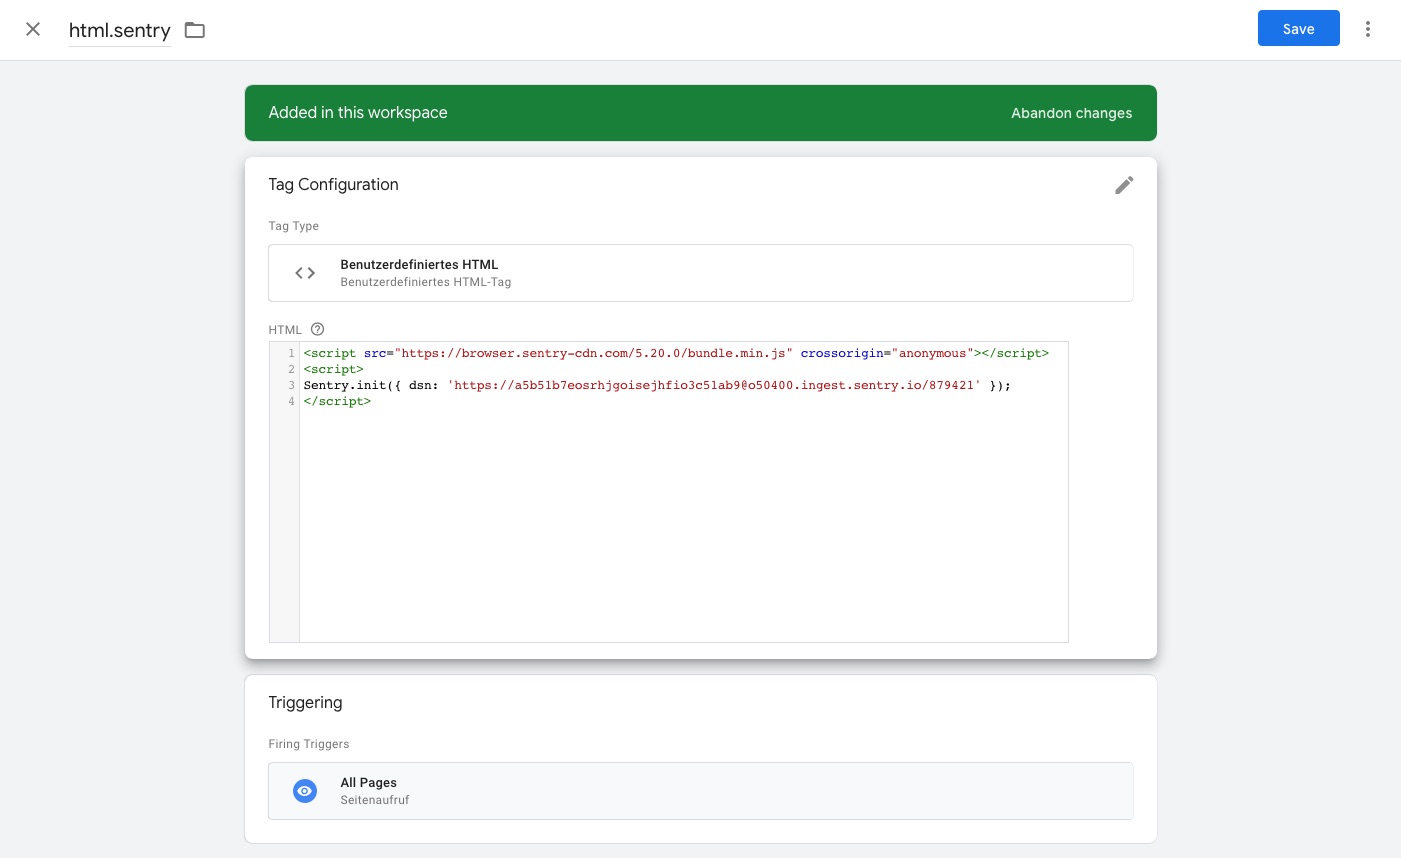
- Paste the CDN hosted snippet into a new Custom HTML Tag inside your GTM
- Remove the
integrityattribute which GTM unfortunately doesn’t support (at this time) - Add the
Sentry.init({…})call in another script tag after it. - Have it fire as early as possible with a Page View Trigger or DOM Ready. Keep in mind that errors which occur earlier than that will not be tracked.
The result should look like this:

If you want, you can use the convenient Sentry Custom Tag Template by Omri Lotan. If you haven’t worked with Custom Tag Templates yet, read Simo Ahava’s article on them. Which method you use shouldn’t make a difference for the examples below.
Basic: Reporting all errors to Sentry
Errors happening inside GTM don’t usually show up in the browser’s console. If they’re not caught earlier, GTM will automatically catch them and report them as a gtm.pageError event in an orderly fashion.
Otherwise they’d trigger a warning in your users’ JS console as Uncaught Exceptions.
Catching these errors is probably a good strategy because in most production scenarios, GTM users and frontend developers are at least different people and usually even totally different teams. Having (possibly less technical) GTM users cause errors they are not aware of could clutter the logs of frontend devs who work on the actual product as opposed to “just tracking”. That in turn would ultimatelöy lead to frustration on both sides so I think GTM’s catch-all approach is pragmatic.
To forward all these gtm.pageError events to Sentry, create a new Custom HTML Tag with the following code:
<script>
(function(){
    if (window.Sentry && window.Sentry.captureException) {
        window.Sentry.captureException(new Error({{Error Message}}), {
            tags: {
                gtmContainer: {{Container ID}},
                gtmDebugMode: {{Debug Mode}}
            },
            extra: {
            }
        })
    }
})()
</script>
If you haven’t already, go to the Variables section of your container and activate the built-in variables {{Error Message}}, {{Container ID}} and {{Debug Mode}}.
Every time a JS error occurs in your container, Sentry’s captureException method is called and reports the error. The Container ID and the info whether or not Debug Mode was active when the error occurred, are sent in the tags object. This can be useful when you have tracked a large number of errors in Sentry and want to filter by those tags.
The extra object can be used to provide additional information, maybe something that is specific for your website like a version number.
For both objects it’s enough to just add attributes, you don’t need to manually configure them again in the Sentry backend.
Trigger a sample error
Your code is perfect? Then just call an undefined function from a Custom HTML Tag to deliberately cause a test error which will then be sent to Sentry:
<script>
callToUndefinedFunction()
</script>
I’m triggering it with a click:

That’s it! All errors happening inside GTM will now be reported to Sentry where you can comfortably analyze and then – hopefully – fix them.
Advanced: Catch errors and add custom context
There are cases where you might want to catch errors yourself though, because you expect that something might go wrong. Catching those errors will allow you to give them even more context which can make it easier to develop a fix.
As an example, let’s imaging we’d want to track the user’s weather with Google Analytics. To get the weather data for that, we depend on information from an external API. If this API has an outage, we’d want to track that as an error in Sentry.
In a Custom HTML Tag:
<script>
(function(){
	fetch("https://exampleweather.com")
    .then(function(response) {
		// … imagine weather tracking here
    })
    .catch(function(error) {
        {{js.log}}(error, "error", "weather")
    })
})()
</script>
The Promise returned by fetch will cause an error and trigger the catch method if the network request fails (e. g. if their server is offline).
Inside this function you’ll see {{js.log}} and that’s where the magic happens.
This Custom JavaScript Variable returns a utility function (a closure) to which we can provide
- the Error object created by the browser
- our desired log level
- the logical part of our container that caused the error. Since this the tag deals with weather data, I’m just calling it “weather”. That way I immediately know which tag the error originated in.
The {{js.log}} variable itself looks like this:
function() {

	/**
	 * Logs an error with Sentry
	 * @param  {Error} error      The Error object you want to report
	 * @param  {string} logLevel  How serious is this error? Can be "debug", "info", "error" or "exception"
	 * @param  {string} component The logical component inside GTM where the error originated
	 */
	var errorTracking = function(error, logLevel, component){
		logLevel = (typeof logLevel !== 'undefined') ?  logLevel : 'info';
		component = (typeof component !== 'undefined') ?  component : 'general';

		if (window.Sentry && window.Sentry.captureException) {

			// Capture the exception to sentry with info level and tags
			Sentry.withScope(function(scope) {
			  scope.setLevel(logLevel);
			  Sentry.setTag('gtm', {{Container ID}});
			  Sentry.setTag('gtm.version', {{Container Version}});
			  Sentry.setTag('gtm.environment', {{Environment Name}});
			  Sentry.setTag('gtm.component', component);
			  Sentry.setTag('gtm.event', {{Event}});
			  Sentry.captureException(error);
			});
		}

	}
	return errorTracking;
}
It only has to be defined once and can be reused across your entire container.
Another example, this time with a try…catch block: Accessing localStorage.
Depending on its privacy settings, Safari may throw an error if you try to store data in the user’s browser. You should catch those errors:
<script>
(function(){
try {
	localStorage.setItem('myCat', 'Tom');
}
catch(error) {
	{{js.log}}(error, "info", "catnamestore")
}
}()
</script>
Only by tracking those errors can you get an idea of how often your attempt to store stuff fails.
Go implement it
If you embrace this error tracking process, you’ll have a much more transparent GTM setup with an easier overview of technical issues. And in the meantime, your analytics data stays clean and only contains data that is truly relevant for your business.
Become a Server Side Tagging Pro with owntag
Take control of your digital data collection with Server Side Tagging and Server Side GTM – easily hosted with owntag.

